
 Do you need to predict artificial light emissions from your project as seen from the view of a sensitive site?
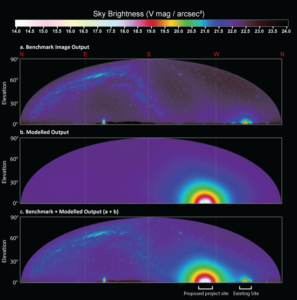
Purpose: Predict the intensity of light from a project across the hemisphere 'as viewed' from an area of interest (e.g. sensitive habitat).
Application: A panoramic quantified image of project-related artificial light is generated using available topography data and the project's lighting inventory. Light modelling can incorporate the existing visible light from a site if monitoring using our Sky42 cameras has been undertaken. This combined output provides a visualisation of the cumulative light to be predicted (i.e. current light + proposed project light). The cumulative light outputs can also be shown with, or without, proposed light mitigation measures, allowing their effectiveness at controlling light to be quantified (and visualised).
Output: Panoramic images (360° wide by 90° high) showing light intensity visible across the entire horizon and sky from a sensitive site. One panorama can be created for different lighting inventory scenarios or zones specific to the project and allow comparison between proposed mitigation measures, such as shielding of lights or changes in wavelength or lumen output.
 Do you need to predict light emissions over a large area?
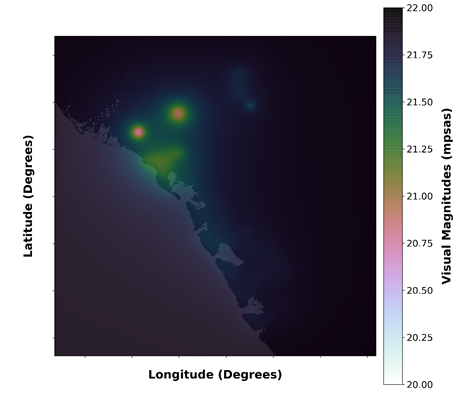
Method: Broadscale Heatmap
Purpose: To predict the impact of artificial light from a project site on the natural night sky over a wide area.
Application: Uses a generated lighting inventory of a project site to predict the impact of light emissions on the visibility of the night sky (overhead) as seen by humans over an area of interest. Useful for understanding light emissions on a regional scale as well as providing relevant data for IDA Dark Sky Place applications.
Output: An interpolated heatmap showing the intensity of light over the area of interest. One map is generated for each given scenario (e.g. Scenario 1 - all lights on, Scenario 2 - some lights off).